
Making connections
Simple idea, hard in practice

Earlier in my career I was involved in the calculus reform movement, an effort to make the undergraduate calculus course more balanced between procedural fluency, conceptual understanding, and applications. A catchphrase of that movement was the Rule of Three, that every concept should be introduced algebraically, graphically, and numerically.1 This idea was paralleled in the K–12 reform movement of the 90s and 00s. But it sometimes got degraded into a rather mindless routine—write a formula, draw a graph, make a table—that lost the main point: the connections. By explicitly making connections between the representations you helped student reify the concept.
Problems that ask students to make connections don’t have to be difficult or complex. They can be as simple as
If (1, 5), (5, 4), and (4, 5) are on the graph of f, which of the following is true? Mark all that apply. (a) f(1) = 5 (b) f(5) = 1 (c) f(1) = f(4) (d) f(4) = f(5).2
The same process of degradation as I saw with the Rule of Three is described in Teaching Mathematics in Seven Countries: Results from the TIMSS 1999 Video Study by Hiebert et al. The study filmed and coded 8th grade lessons, including about 80 in the US, and compared instructional practices and the structure and content of lessons across countries. It analyzed the teaching of thousands of mathematics problems. It categorized problems into using procedures, stating concepts, and making connections. The latter were defined as
Problem statements that implied the problem would focus on constructing relationships among mathematical ideas, facts, or procedures. Often, the problem statement suggested that students would engage in special forms of mathematical reasoning such as conjecturing, generalizing, and verifying.
The report gives the following as an example of a problem that would be classified as making connections.
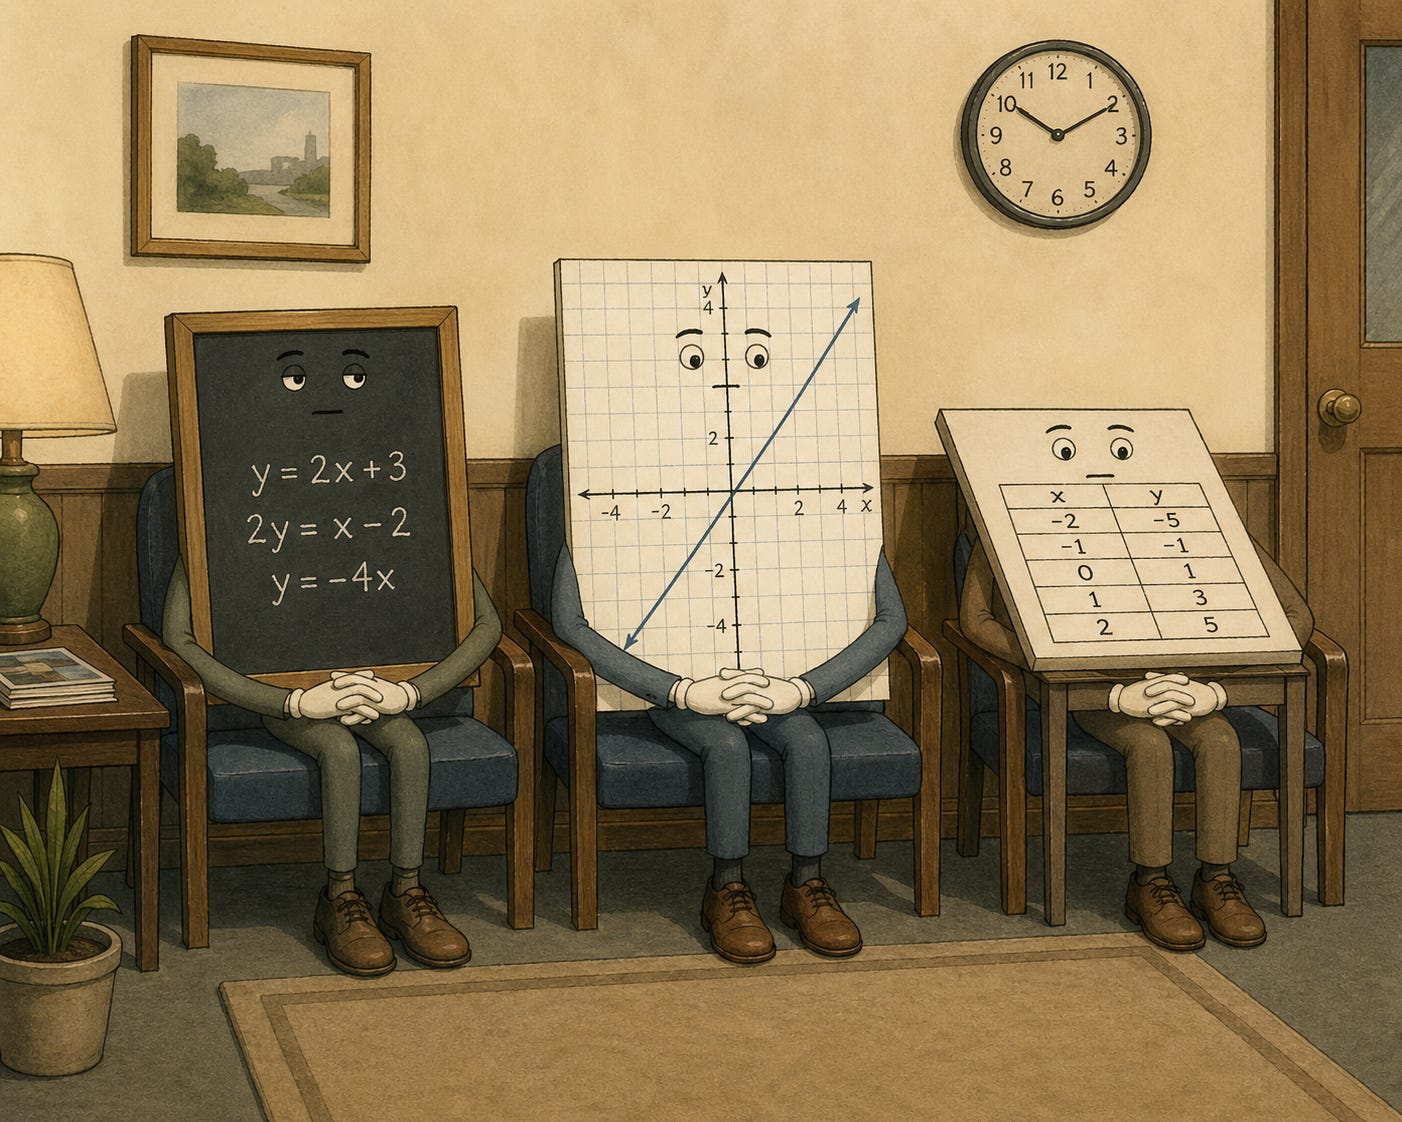
Graph the equations y = 2x + 3, 2y = x − 2, and y = −4x, and examine the role played by the numbers in determining the position and slope of the associated lines.
Each problem was coded both for how it was stated and how it was actually taught.
Before I give the results I want to note that the report thanks the teachers who agreed to be filmed for “opening the classroom door,” and that the report is about a pattern across US lessons, not about any individual teacher’s practice. You can see some of the videos here as examples of the pattern.
About 17% of problems in US classrooms were coded as making connections problems. Less than 1% were solved that way (p. 103, fig. 5.12—the number rounds to zero in the figure).
Instead of solving these problems publicly through making connections, teachers and students . . . in the United States often solved them by giving results only [33%] or by using procedures [59%].
This finding is striking. But before we jump on it, let’s look at the example of a making connections problem that the report gave. It’s very open ended! I wouldn’t blame a student for not knowing what to do with it, and I wouldn’t blame a teacher for reducing it to a demonstration.3 A sharper problem along the same lines that would still be about making connections would be to give the three equations and the three graphs and ask students to match them up, without actually graphing the equations. You could make it an activity, individual or in groups or in a whole class discussion. Students would learn from hearing each other’s answers.
In The Teaching Gap by Stigler and Hiebert, a book based on the earlier 1995 TIMSS video study, the authors talk about different countries having different cultural scripts. A cultural script is a set of expectations about what a math lesson is supposed to look like, reproduced by teachers, students, administrators, parents, textbooks, and tests in a mutually reinforcing system. I would guess that the striking result above is a result of the US cultural script and its influence not only on teachers, but also on textbook writers. If teachers were always working with activities that were either procedural, or big and open-ended, then the pressure to keep things procedural would be stronger.
I assume everybody wants students to make connections in the mathematics they are studying, and I assume everybody wants a cultural script that is different from the one that produced that drop from 17% to essentially zero. But changing the script is not simply a matter of telling teachers they have to change everything they are doing. In my Friday post I want to talk more about how we can support a cultural script that helps students make connections.
For teachers reading, when you plan an activity designed to make a connection between representations or ideas or procedures, what makes it harder or easier to keep that work alive in the lesson? What pulls it toward just showing the steps or giving the answer?
Later rebranded as the Rule of Four when people wanted to add the verbal aspect.
If you think this is too easy for your students, try it.
To be fair, I think this example was constructed by the researchers, not taken from a filmed lesson, because the same task appears in the Appendix D coder-training manual. For that purpose the open-endedness probably serves well.
Malcolm Swan was the master of designing activities that benefitted classrooms with widely varied levels of prior knowledge. Card sorts came out of his low floor high ceiling program of design and research. Card sorts are great for connections in a wide distribution classroom. They are not a computer program, but a great component.
Comment about a "side thread" which might be of interest to this community: in a course I created for students to be better prepared for College Algebra (so Algebra 1 level), we took the Rule of Three/Four and evolved a bit.
- "Tables" has become "Tables/Data" and "Verbal" has become "Context". This is to emphasize mathematical modeling, the focus of the course. So for example one can look at a figure from a physiology paper and ask students what the .38 means in the y = .38 x + 64.2 regression line presented, looking for answers such as "for every RPM faster the subjects were pedaling on the exercise bike, their heart rate goes up .38 beats per minute". (Or, better yet, for every 10 RPM...)
- The Rule of Four has become the Rule of Six (four choose two). In fact I (but not other instructors - yet) like to draw for students these four aspects and twelve (directed) translations between them to form a "diamond" - precious, clear, compact, as scientists (including social scientists and folks in business etc) need in order to to use these tools to understand the world.